Raspberry Pi Magnetometer
Overview
In December 2014, BGS and the University of Lancaster won an STFC Public Engagement grant to build and deploy 10 Raspberry Pi magnetometers to secondary schools across the UK.
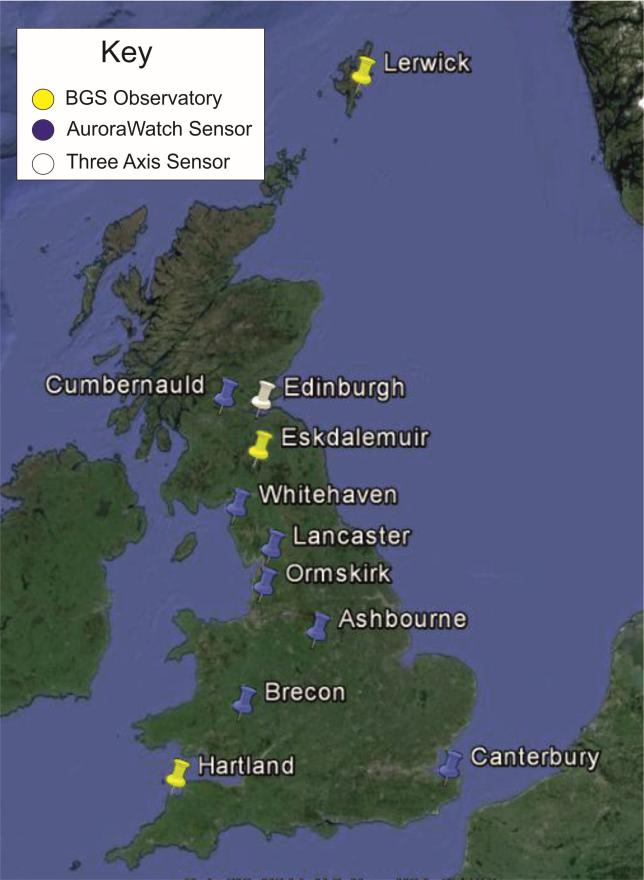
We are currently in the process of building the magnetic field sensors. These will add to the existing schools variometer network from AuroraWatch set up by the University of Lancaster (Figure 1).
The aim is to encourage students from 14-18 years old to look at how sensors can be used to collect geophysical data and integrate it together to give a wider understanding of physical phenomena.
A second aim is to provide useful data on the spatial variation of the magnetic field for analysis of geomagnetic storms, alongside data from the BGS observatory and SAMNET variometer networks.
A three-axis Raspberry Pi magnetometer
The system uses a Raspberry Pi computer as a logging and data transfer device, connected to a set of miniature fluxgate magnetometers.
The system has a nominal sensitivity of around 1 nanoTesla (nT), in each component direction (North, East and Down).
This is around twenty times less sensitive than a current scientific-level instrument, but given its relatively low-cost, at about �250 per unit, this is an excellent price-to-performance ratio (i.e. you don�t really improve your sensitivity much by spending more money).
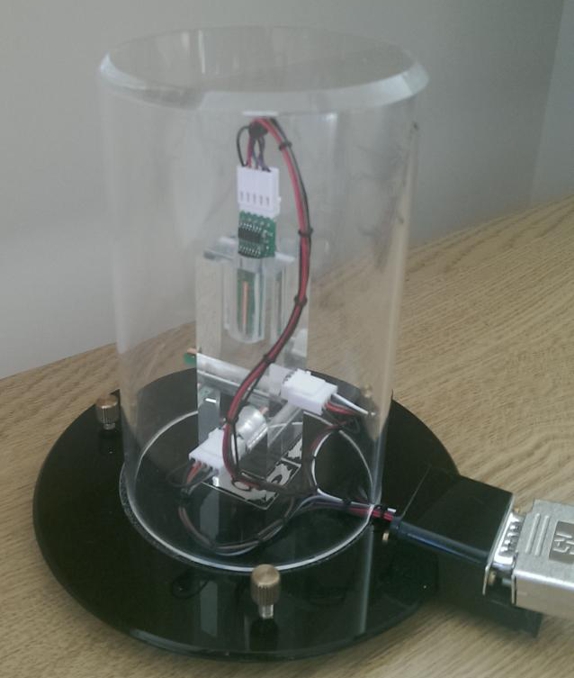
Three FLC100 magnetometers from Stefan Mayer Instruments are mounted orthogonally (North, East and Down) into a Perspex block and wired together to common power and ground (Figure 2). The FLC100 magnetometers output a voltage proportional to the strength of the magnetic field.
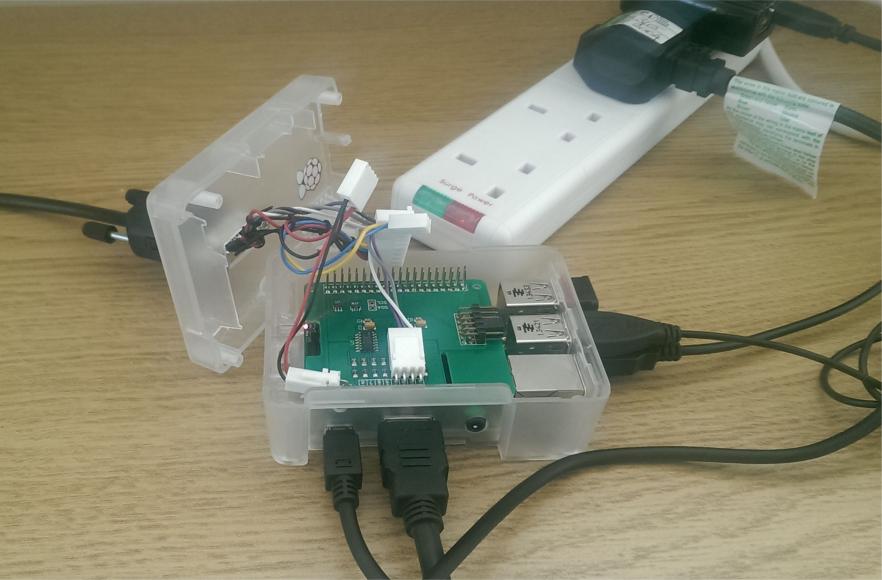
The output voltage is digitised by an AB Electronics 17-bit digitiser connected to a Raspberry Pi computer (Figure 3).
Software written in Python is used to read and record the values of the magnetic field from each component along with the date and time.
The system also includes a thermocouple to measure ambient temperature and an LED to show the unit is powered on.
Comparison to scientific observatory data
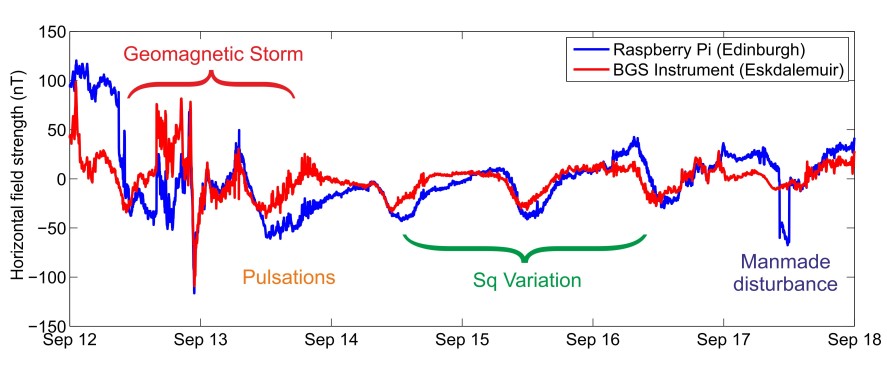
During September 2014, we recorded the Horizontal variation as measured by the Raspberry Pi magnetometer in the BGS office in Edinburgh. These measurements were compared with the data from the scientific instruments at the Eskdalemuir observatory which lies approximately 70km south of Edinburgh.
The Raspberry Pi detected several geomagnetic phenomena such as a storm, pulsations and the solar quiet variation. It is also sensitive to local (manmade) disturbances.
The direct comparison between the two sensors is surprisingly good (Figure 4) and gave us confidence that the system could be genuinely useful for scientific investigations.
Sensitivity and noise tests
Next, we made more detailed comparisons of the Raspberry Pi magnetometer with Eskdalemuir observatory data. This involved a noise test and further direct comparisons to the BGS scientific instruments.
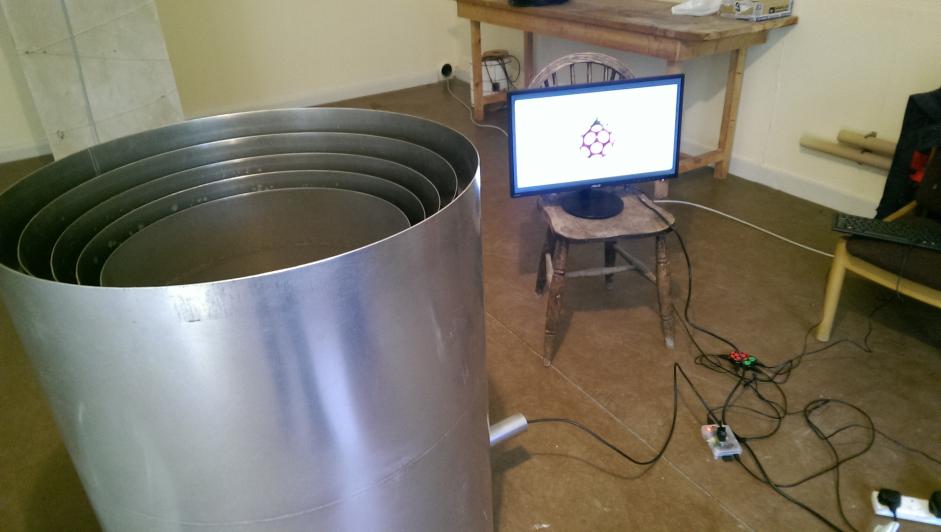
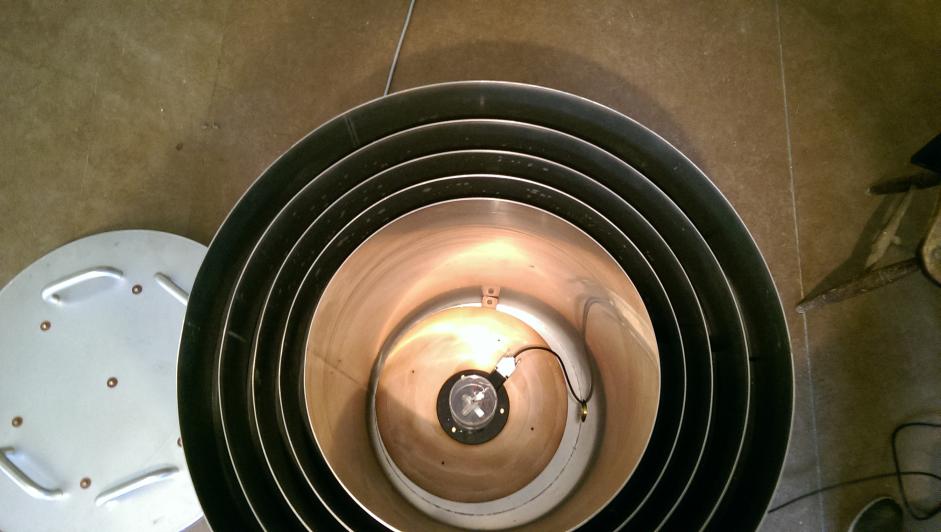
In January 2015 we made a trip to the Non-Magnetic Laboratory in Eskdalemuir (a glorified wooden shed in reality). To test the performance of the whole system itself, the sensor block was placed into a mu-chamber (Figure 5 and Figure 6) which reduces the background magnetic field to around 10 nT and damps short period variations � so it�s a bit like the vocal booth in a recording studio � �deadening� any outside signals.
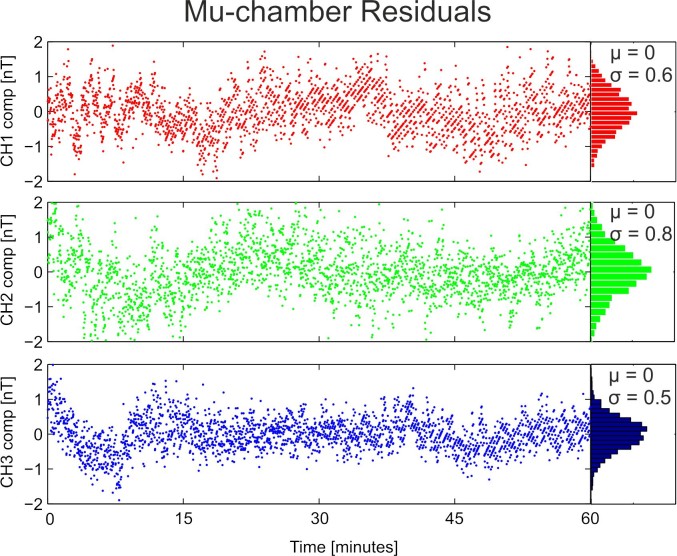
Data from the magnetometer were recorded at a cadence of 2 seconds for several hours. The residuals (once the background average has been removed) show an approximately Gaussian distribution with standard deviation of less than 0.8 nT (Figure 7). Again, this means the system is performing well within the nominal requirements we set (< 1 nT).
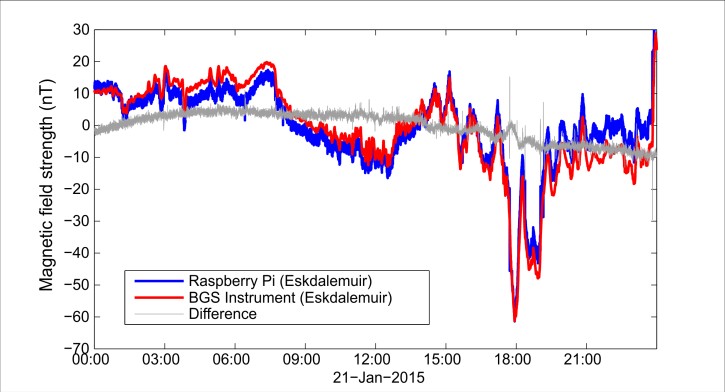
The Raspberry Pi was left to record at Eskdalemuir in the Non-Magnetic Laboratory for a few days. The Horizontal component for the 21st January 2015 is shown in Figure 8. The residuals (i.e. differences) between the data recorded by the Raspberry Pi system and the BGS scientific instrument are small and long-period � probably related to temperature variation throughout the day. As the system is now measuring the full field (rather than just the internal �noise�), the root-mean-square (RMS) value of the residuals is larger at about 1.5 nT.
A bit of an upgrade
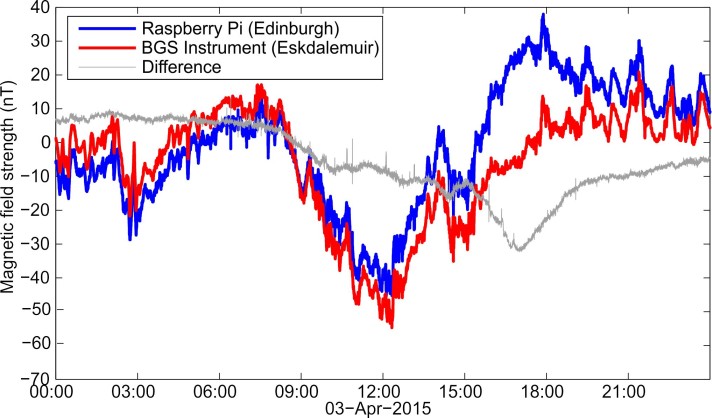
In April, we upgraded the digitiser from a 16-bit to a 17-bit version and used the newer Raspberry Pi B+ system to record data in the BGS office in Edinburgh.
The instrument is not temperature controlled, so responds to the cooling and warming of the air, particularly during the afternoon when the sun shines through the window on the west.
The newer Raspberry Pi is also more electrically quiet. Previously we observed regular spikes in the data - due to voltage drops of around 0.5 V when the Pi went into some sort of system refresh cycle.
The new model of the Raspberry Pi (B+) and digisiter reduces the difference of the residuals to around 0.7 nT, which is a nice improvement overall (Figure 9). Note how the thickness of the grey line is reduced between Figure 8 and 9.
Next steps
We aim to complete the build and testing of the 10 Raspberry Pi magnetometers for deployment into schools by September 2015.
The programme will run for a further 15 months in collaboration with the schools to understand how the systems behave in real world environments and to develop educational materials (e.g. notes/code)
We hope the data collected will be useful for educational purposes but also for space weather applications and analysis. A better knowledge of how the magnetic field varies during large storms will be scientifically useful for example in understanding peak rates of change across the UK.
More information
We wrote an article describing the deployment of magnetometers to schools. You can read it here.
Read our paper in Geoscience Communications about building a Raspberry Pi school magnetometer network in the UK. This describes the development and deployment of the magnetometers. In addition it shows results recorded for the September 2017 magnetic storm.
Acknowledgements
We wish to acknowledge the receipt of funds from the NERC Engaging the Public Award (2013) for purchase for the initial prototypes of the variometers and the STFC Public Engagement Small Grant (2015) for the development and deployment of the ten Raspberry Pi magnetometers for placement into UK schools.
Contact
For more information please contact Dr Ciarán Beggan.