High-frequency Magnetometers
An induction coil (or high frequency magnetometer) consists of two coils of insulated copper wire wound around an iron core. Induction coils permit us to measure the very rapid changes of the magnetic field at frequencies between 0.1 and 1000 times per second. This part of the electromagnetic spectrum is called the Extremely Low Frequency (ELF) range.
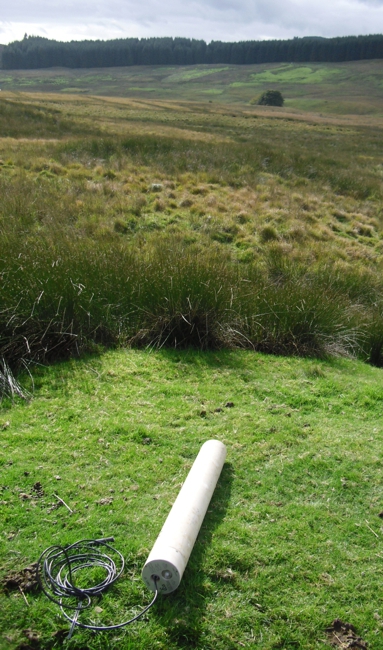
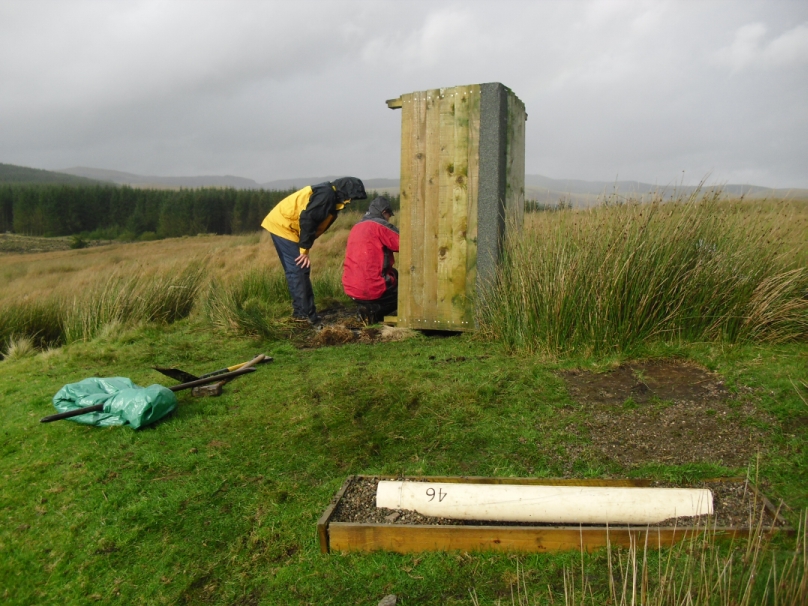
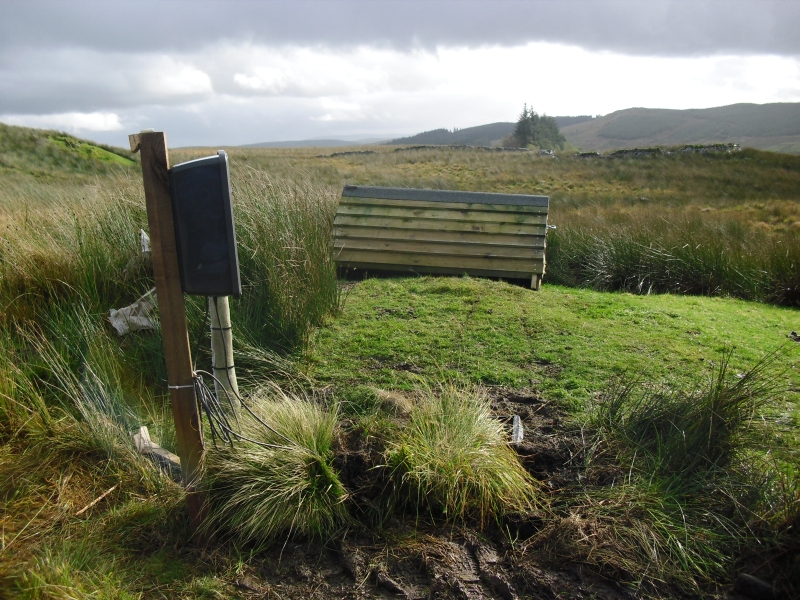
In June 2012, the BGS Geomagnetism team installed two high frequency (100 Hz) induction coil magnetometers at Eskdalemuir Geophysical Observatory in the Scottish Borders. The coils were installed on the Eskdalemuir observatory site, an electromagnetically quiet region of the UK. The coils (white tube, Figure 1) were placed under a protective wooden covering in an empty field (Figure 2) and are linked to the internet via a computer system in the seismic vault about 100 metres away. A small breakout box and digitiser lie close to the coils (Figure 3). The data from the induction coils are returned on an hourly basis to BGS Edinburgh.
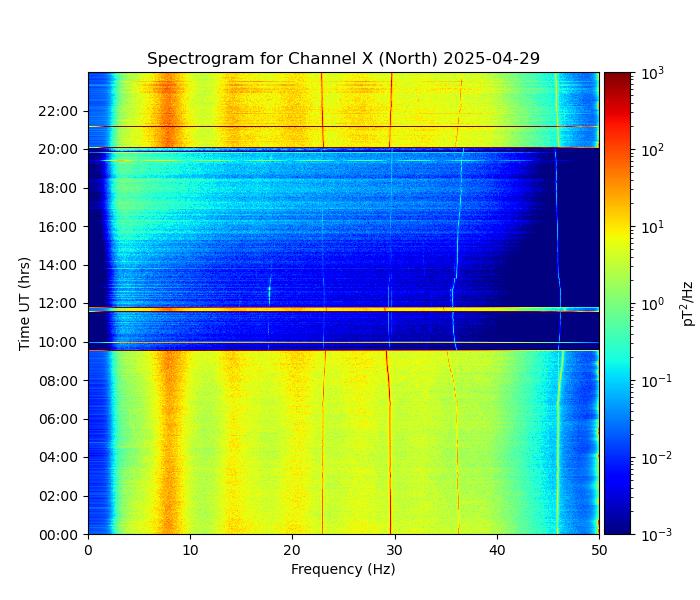
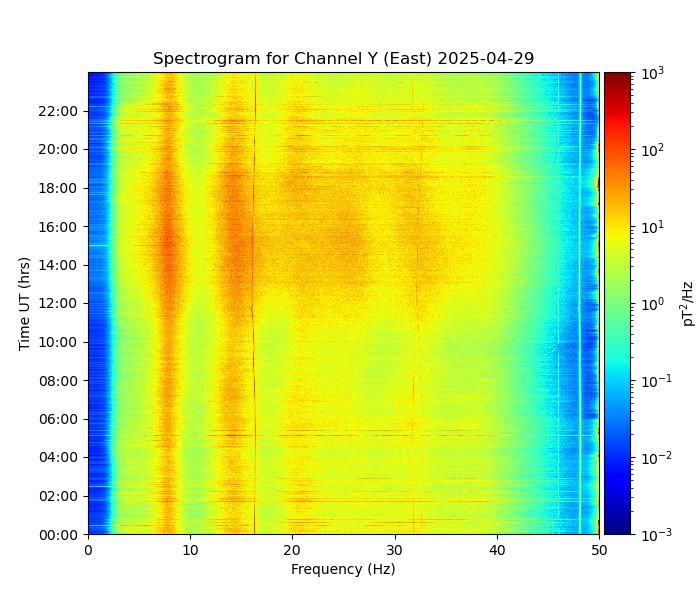
Figure 4 shows an example spectrogram (i.e., power at each frequency versus time) from the North pointing (Channel 1) coil for 23rd July 2012, filtered over the frequency band of 3-50 Hz. The diffuse bands of peak power at all times (i.e. vertical diffuse red regions denoted by arrows) are the global Schumann resonances, while the strong broadband (horizontal) spikes are due to local lightning activity or short system errors. Note also the strong thin peak at 25 Hz is a harmonic of the UK electrical power system (which ‘hums’ continuously at 50Hz).
A new set of calibrated MFS05 coils and supporting electronics were installed August 2024. The data cadence was increased to 128 Hz as a consequence.
The Schumann resonances are a natural set of spectral peaks in the ELF portion of the Earth's electromagnetic field spectrum, caused by lightning discharges from within the cavity formed by the Earth's surface and the ionosphere [1]. Schumann resonances occur because the space between the surface of the Earth and the conductive ionosphere acts as an (almost) closed waveguide, and should appear as distinct peaks around 7.86 Hz (the fundamental frequency), 14.3 Hz, 20.8 Hz and so on. However, in reality the peaks tend to be diffuse due to the effects of a leaky cavity, ground absorption and the geometry of global lightning storms [2].
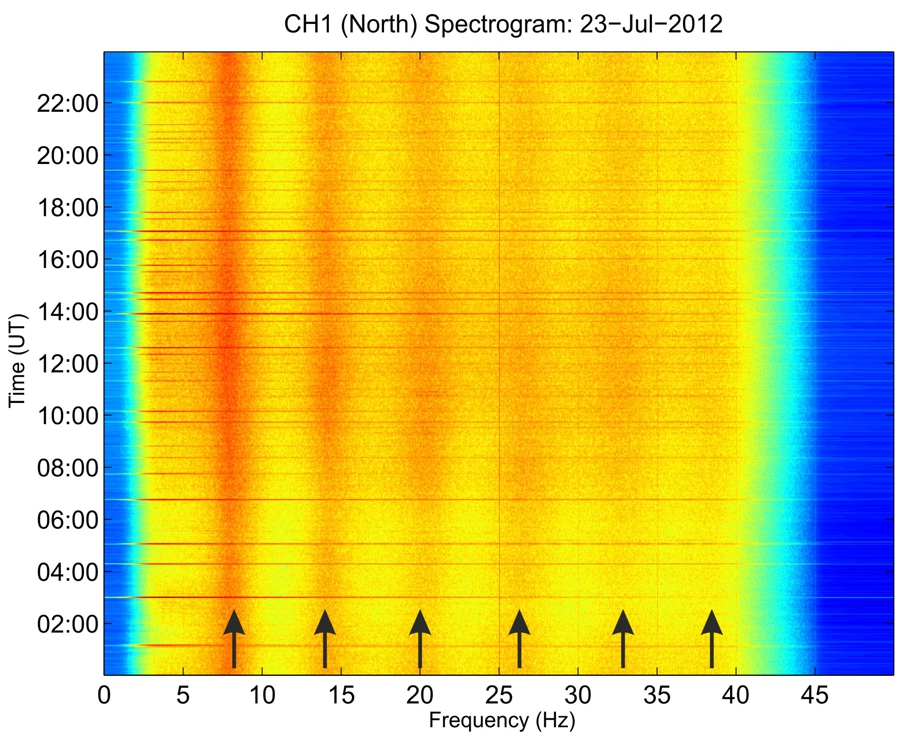
This research project is providing new data for monitoring global lightning storms and related ionospheric phenomena [3]. For example, note the diminished intensity in Figure 4 during the local UK night time until about 08.00. This is due to the lack of thunderstorm activity as the Sun passes over the Pacific Ocean. Later in the day, the heat from the sun shining over the equatorial land regions such as Africa begins to trigger thunderstorm formation. Consequently there is an increase in lightning activity and the Schumann resonances become stronger.
Spectrograms of yesterday's data are available below.
Data Availability
The induction coil data are available via the NERC National Geoscience Data Centre. In the Deposited Data Search page, enter 'Eskdalemuir' into the Simple Search box to find the high frequency magnetic field induction coil data from Eskdalemuir Observatory, UK for each year. Use View Record to download the raw data (zipped up it is around 12 Gb per year) along with some example Matlab code to create spectrograms.
Can Schumann Resonance Intensity Predict Super El Niños?
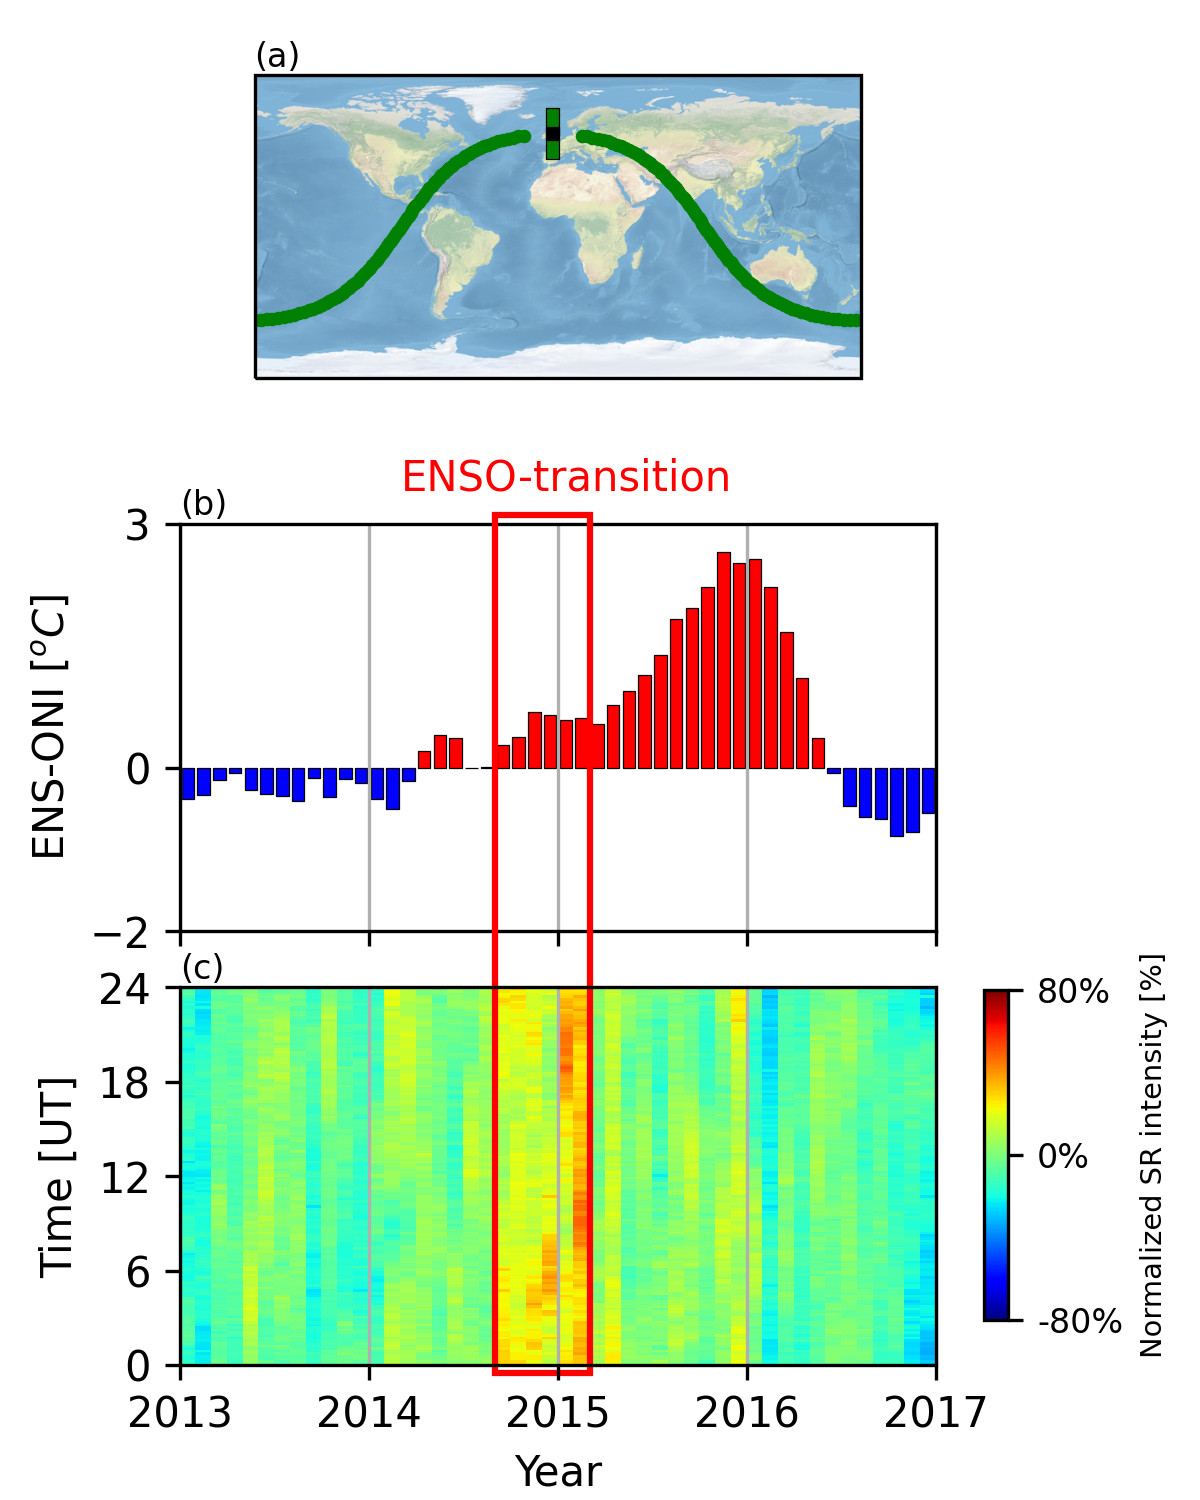
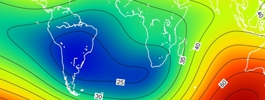
In a paper in the Journal of Geophysical Research (Williams et al, [2021]), we speculate as to whether there are pre-cursors to large El Niño events. These super El Niños are rare (every 20 years or so) but large events occurred such as in 1998 and 2015. Looking at Eskdalemuir induction coil data, we noted that the average intensity of the first Schumann Resonance appeared to increase dramatically several months before the 2015 El Niño event. This was also observed at other stations around the world (see the paper). The plot to the right shows three panels. The upper panel is a map showing the direction that the north-south orientated coil is most sensitive to. It can sense most easily variations along the great circle (red line) towards India and Western Australia, and through the Carribean regions. The central panel is a measure of the El Niño Southern Oscillation Index showing the large intensity in 2015/16. The bottom panel is the normalised intensity of the first Schumann resonance at Eskdalemuir between 2013 and 2017. In the initial stages of the El Niño, before it reaches its maximum, there is an obvious rise in the amount of energy received. This does not happen for other El Niño events - just the very largest - and is speculated to be due to the reorganisation of the weather systems in the Pacific region which temporarily increases the number of lightning strikes.
Acknowledgements
We wish to thank Thibaud Gabillard for developing and coding the intial spectrogram generating software. With special thanks to Gosia Musur for her efforts
in processing and analysing data for publications (see Papers). The Williams et al. (2021) image was provided by Tamás Bozóki.
For more information please contact Dr Ciarán Beggan. There is more explanation of the Schumann Resonances and IARs on this page.
References
[1] Füllekrug, M., 1995. Schumann Resonances in Magnetic-Field Components. Journal of Atmospheric and Terrestrial Physics, 57, pp. 479-484. doi:10.1016/0021-9169(94)00075-Y[2] Simões, F., Pfaff R. and H. Freudenreich, 2011, Satellite observations of Schumann resonances in the Earth’s ionosphere, Geophysical Research Letters, 38, L22101, doi:10.1029/2011GL049668
[3] Williams, E.R., 1992, The Schumann resonance: a global tropical thermometer, Science 256, 1184-1186. doi:10.1126/science.256.5060.1184
- Global Geomagnetic Models
- Space Weather and Geomagnetic Hazard
- High-frequency magnetometers
- Schumann Resonances
- Geoelectric field monitoring
- Space Weather Impact on Ground-based Systems (SWIGS)
- SWIMMR Activities in Ground Effects (SAGE)
- Geomagnetic Virtual Observatories
- Quantum magnetometers for space weather
- Magnetotellurics
- Publications List
- Paper - Modeling and observations of the effects of the Alfvén velocity profile on the Ionospheric Alfvén Resonator (2024)
- Paper - Climatology of the Harmonic Frequency Separation of Ionospheric Alfvén Resonances at Eskdalemuir Observatory, UK (2023)
- Paper - Evolution of global lightning in the transition from cold to warm phase preceding two super El Niño events (2021)
- Paper - Automatic detection of Ionospheric Alfvén Resonances in magnetic spectrograms using U-net (2020)
- Paper - Is the Madden-Julian Oscillation reliably detectable in Schumann Resonances? (2019)
- Paper - Observation of Ionospheric Alfvén Resonances at 1--30 Hz and their superposition with the Schumann Resonances. (2018)
- Automatic detection of ionospheric Alfvén resonances using signal and image processing techniques (2014)
